Track SLA compliance and schedule automated reports in QUARK.
SLA Reports lives in the QUARK sidebar as its own page — no need to go through the assistant. It has three tabs: Latest report, Schedules, and Settings.
Latest report
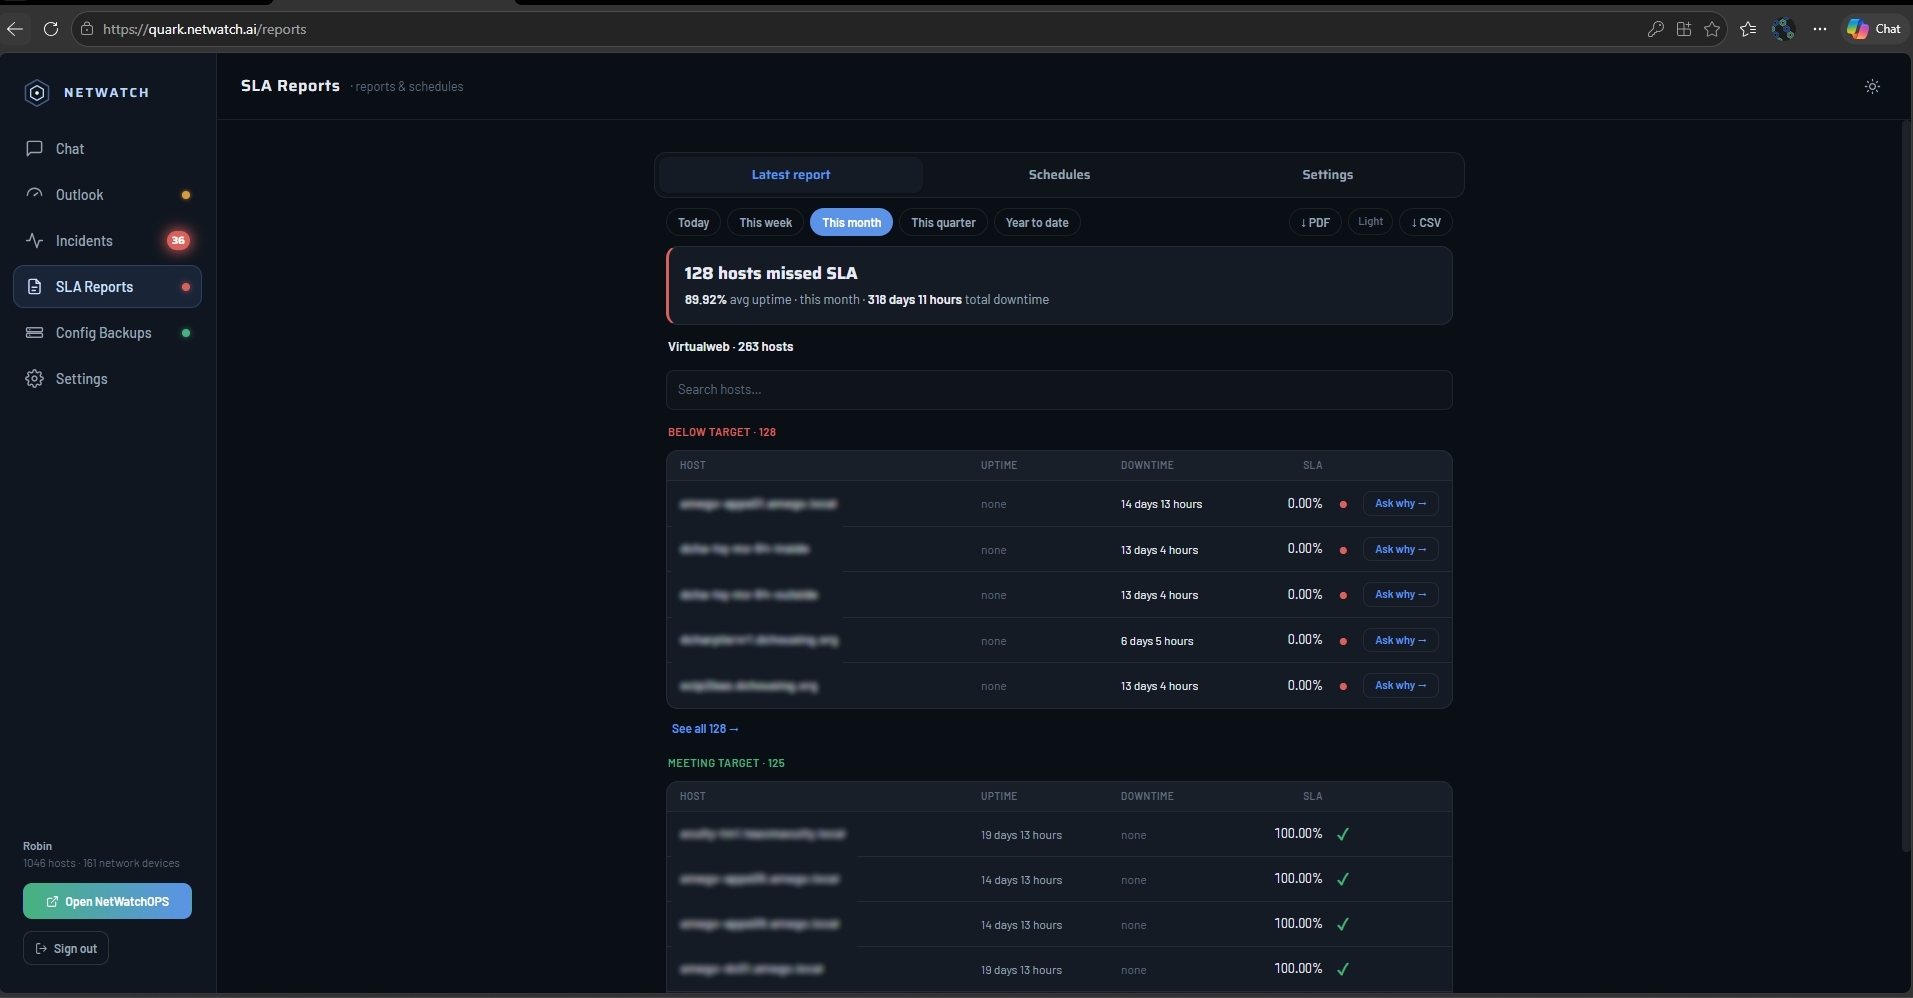
Pick a period — Today, This week, This month, This quarter, or Year to date — and the page shows every host against your SLA target for that window.
A summary card at the top gives the headline numbers: how many hosts missed SLA, average uptime across the fleet, and total downtime for the period. Hosts are then split into two tables:
- Below target — hosts that breached the SLA target, with their uptime, downtime, and SLA percentage. Each row has an Ask why → link that jumps to root-cause context for that host's downtime.
- Meeting target — hosts that stayed within target for the period.
Use the search box to filter either list down to a specific host, or See all → to expand the full below-target list.
Export the report with the PDF or CSV buttons in the top right.
Schedules
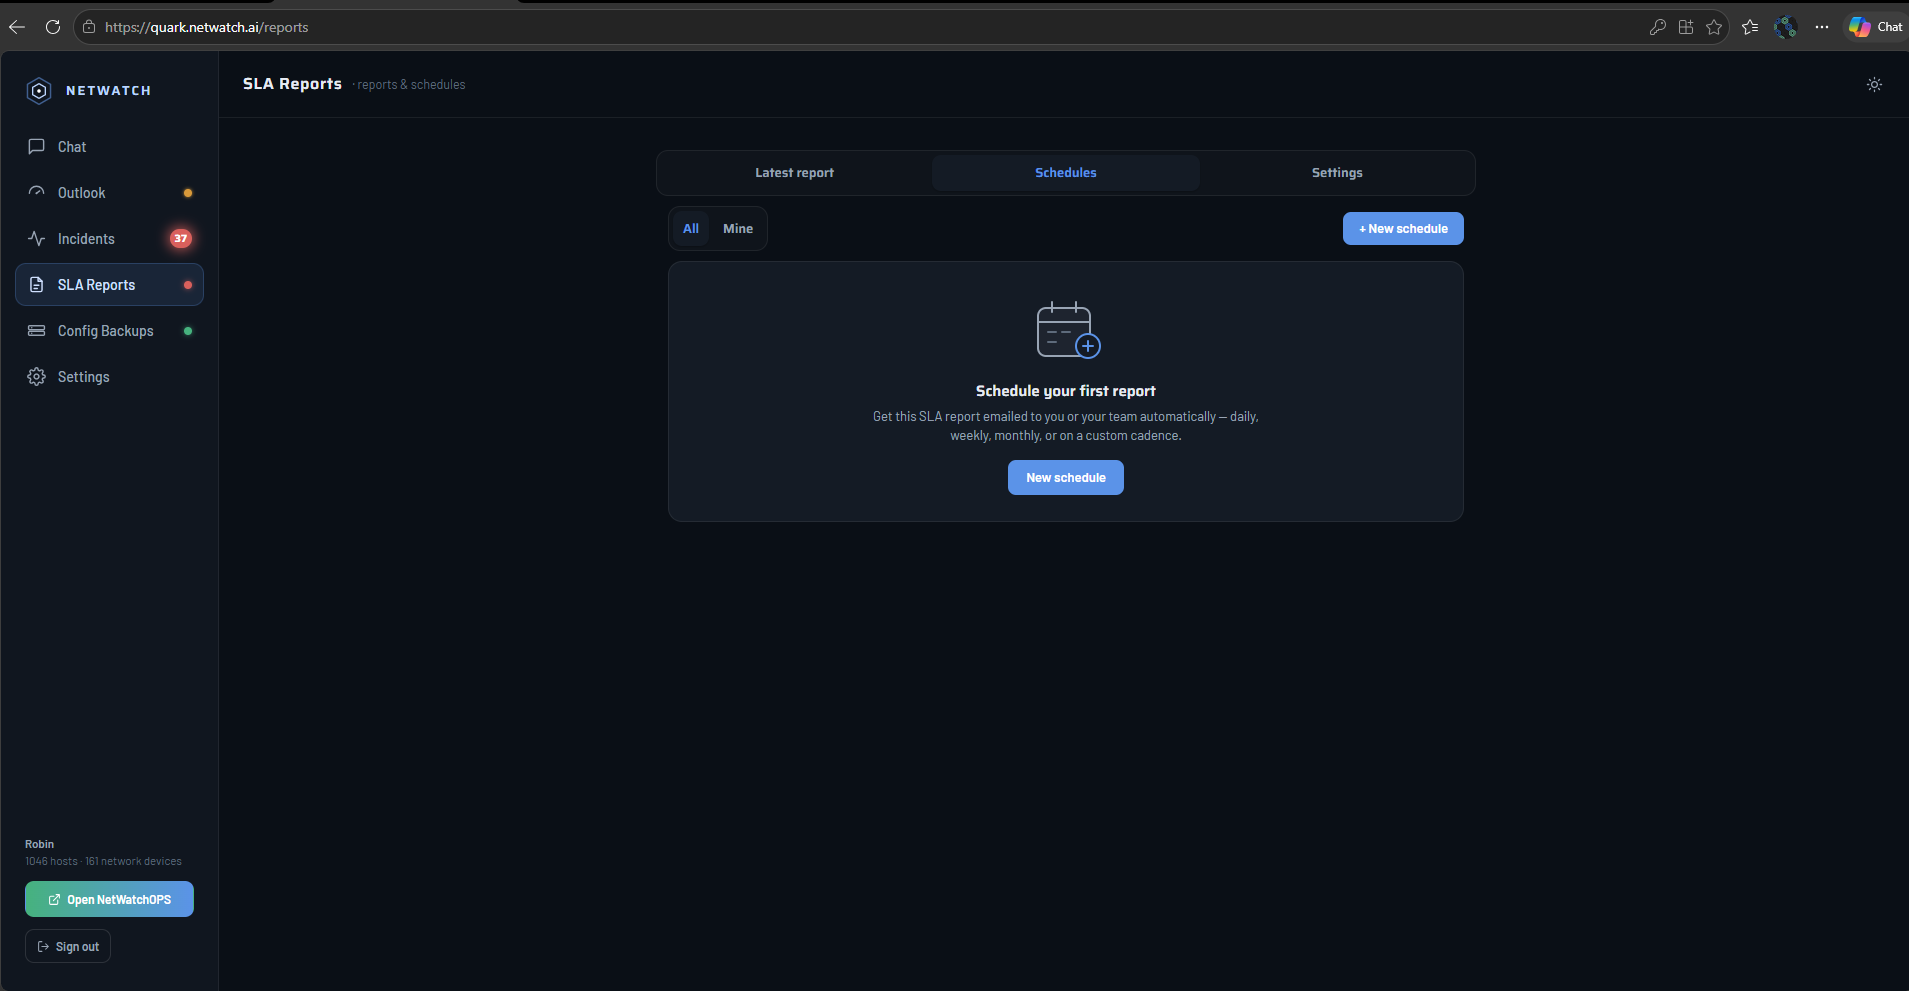
Switch to the Schedules tab to have this report emailed out automatically instead of pulling it up by hand. Toggle All / Mine to see every schedule on the account or just your own.
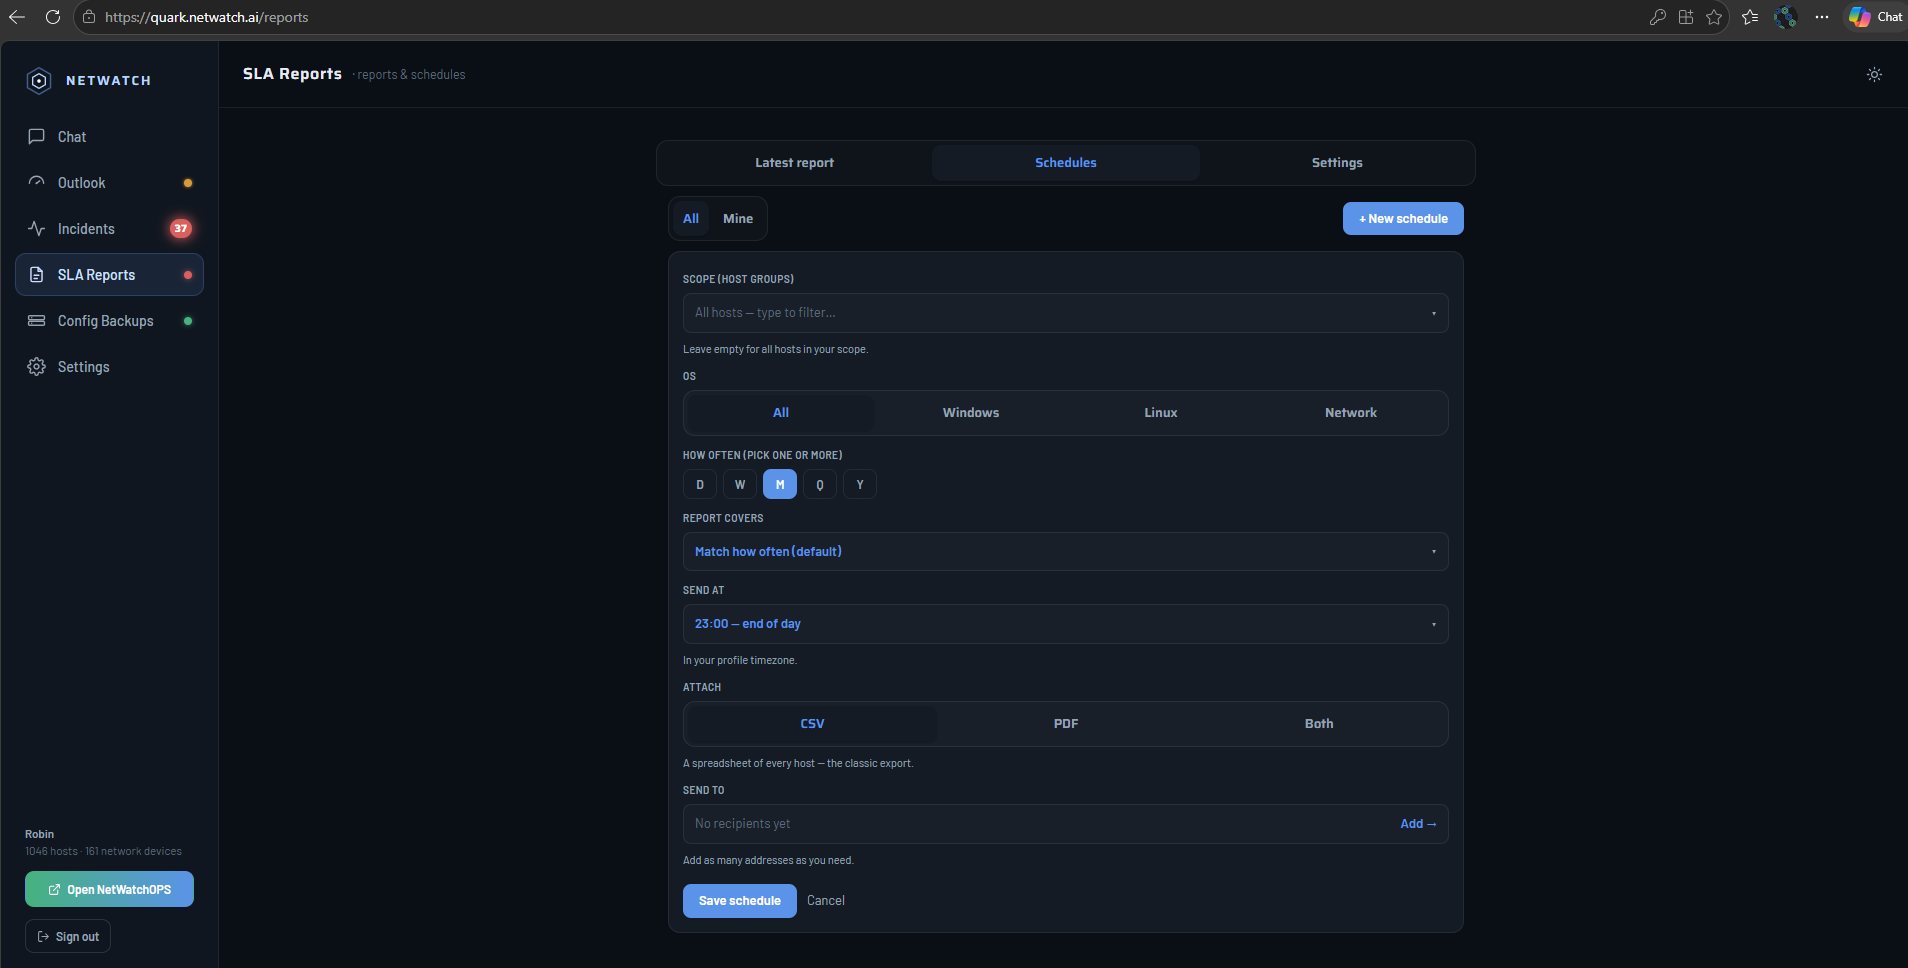
Click + New schedule to create one:
- Scope (host groups) — which host groups the report covers. Leave empty to include all hosts in your scope.
- OS — filter to All, Windows, Linux, or Network devices.
- How often — Daily, Weekly, Monthly, Quarterly, or Yearly (pick one or more).
- Report covers — the period the report summarizes; defaults to matching the send frequency.
- Send at — time of day the report goes out, in your profile's timezone.
- Attach — CSV, PDF, or both. CSV gives a spreadsheet of every host; PDF is the formatted report.
- Send to — one or more recipient email addresses.
Click Save schedule to activate it.
Settings
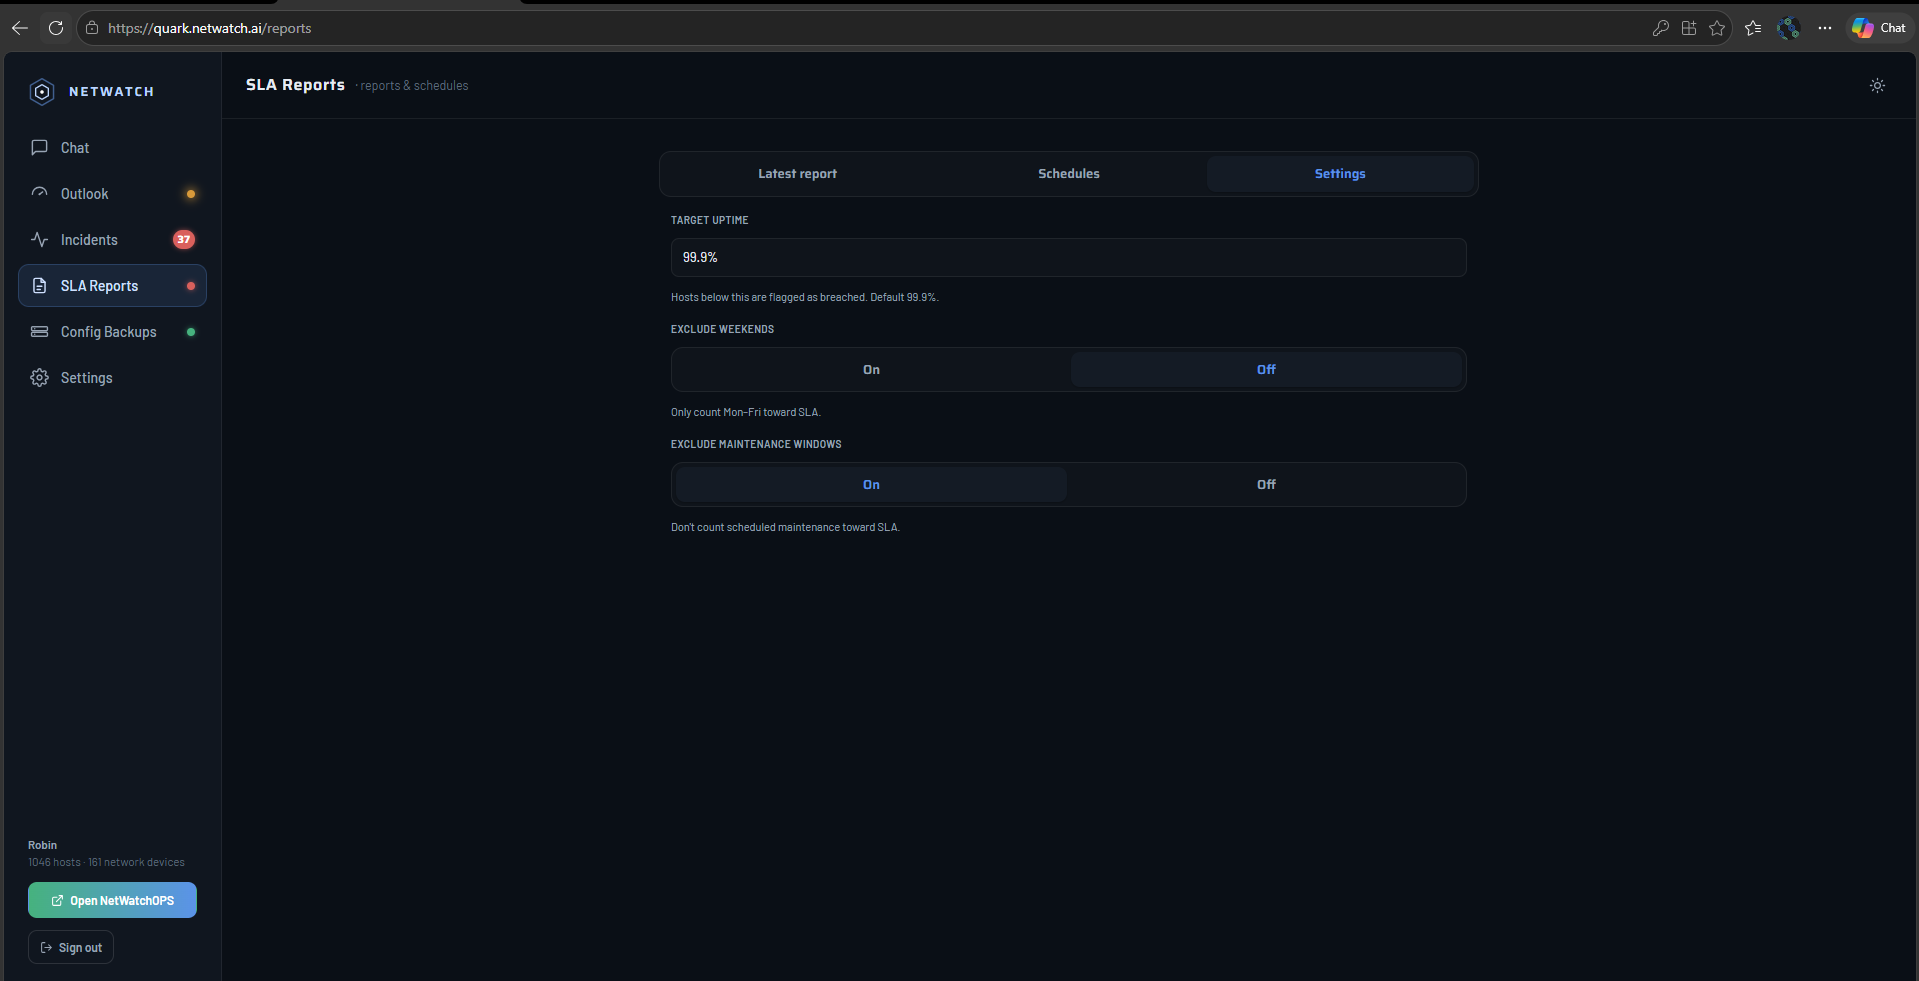
The Settings tab controls how SLA is calculated for every report and schedule:
- Target uptime — the threshold a host must meet to avoid being flagged as breached. Defaults to 99.9%.
- Exclude weekends — when on, only Monday–Friday counts toward SLA.
- Exclude maintenance windows — when on, scheduled maintenance doesn't count against a host's SLA.