Configuring Nutanix Monitoring in Netwatch
Overview
Netwatch supports comprehensive monitoring of Nutanix Hyperconverged Infrastructure (HCI) through REST API integration with Nutanix Prism Element or Prism Central. This integration enables visibility into cluster performance, storage capacity, host resource utilization, container usage, and infrastructure alerts, allowing proactive monitoring and faster incident response.
What Netwatch Monitors in Nutanix
Netwatch can collect and monitor the following Nutanix metrics:
- Storage Metrics
- Total storage capacity
- Used and available space
- Storage utilization percentages
- Performance Metrics
- Cluster IOPS
- Read/write operations
- IO latency
- Host Resources
- CPU usage per host
- Memory utilization across hypervisor hosts
- Container Storage
- Container capacity
- Used and free space
- Utilization trends
- Alert Management
- Critical, warning, and informational alerts from Nutanix Prism
- Discovery
- Automatic discovery of clusters, hosts, and storage containers
Prerequisites
Before configuring Nutanix monitoring in Netwatch, ensure the following requirements are met:
- Nutanix Prism Element or Prism Central with API access enabled
- API credentials (username and password) with at least read-only permissions
- Network connectivity from the Netwatch server to the Nutanix Prism IP address (default port 9440)
- An active and accessible Nutanix cluster
1. Configure Nutanix API Access
- Log in to the Nutanix Prism Element interface.
- Create a dedicated monitoring user or use an existing account with read-only API permissions.
- Note the Prism Element IP address and API port (typically 9440).
- Verify API accessibility using the following endpoint:
2. Add Nutanix Host in Netwatch
- Navigate to Configuration → Hosts.
- Click Create Host.
- Enter the following details:
- Host name: A descriptive name for the Nutanix cluster (e.g., Nutanix-Production)
- Host group: Select an appropriate group (e.g., Hyperconverged Infrastructure)
- Agent interface: Enter the Nutanix Prism Element IP address
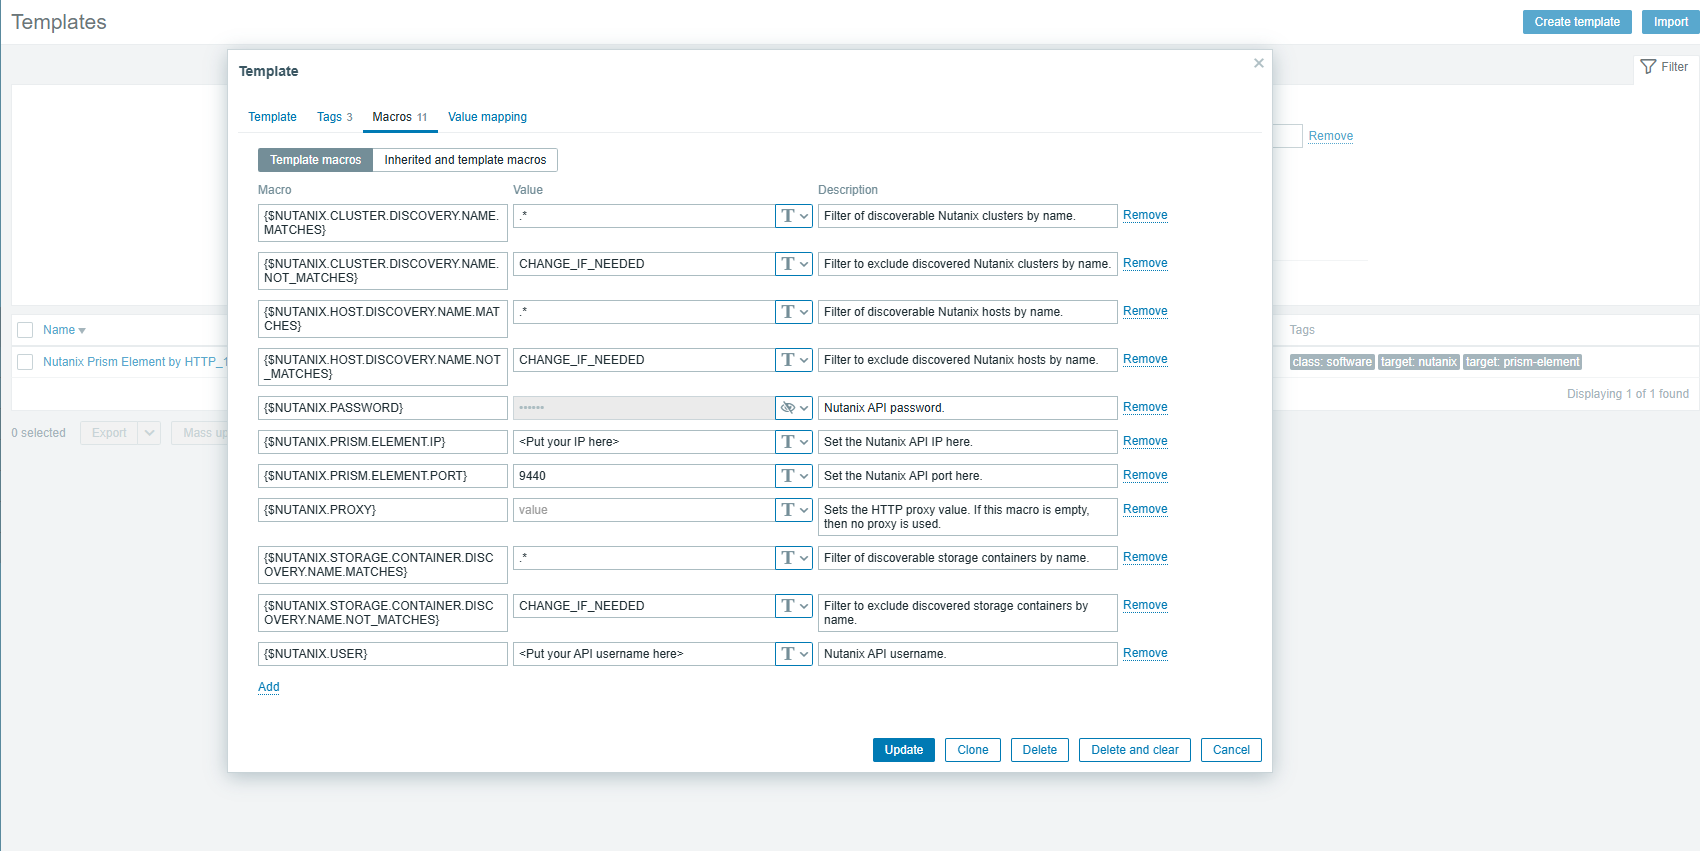
- Go to the Macros tab and add the following macros:
{$NUTANIX.PRISM.ELEMENT.IP}: Prism Element IP address (e.g.,172.XXX.XXX.XXX){$NUTANIX.USER}: API username (e.g.,netwatch){$NUTANIX.PASSWORD}: API password (use a Secret Text macro for security)
- Click Update to save the host configuration.
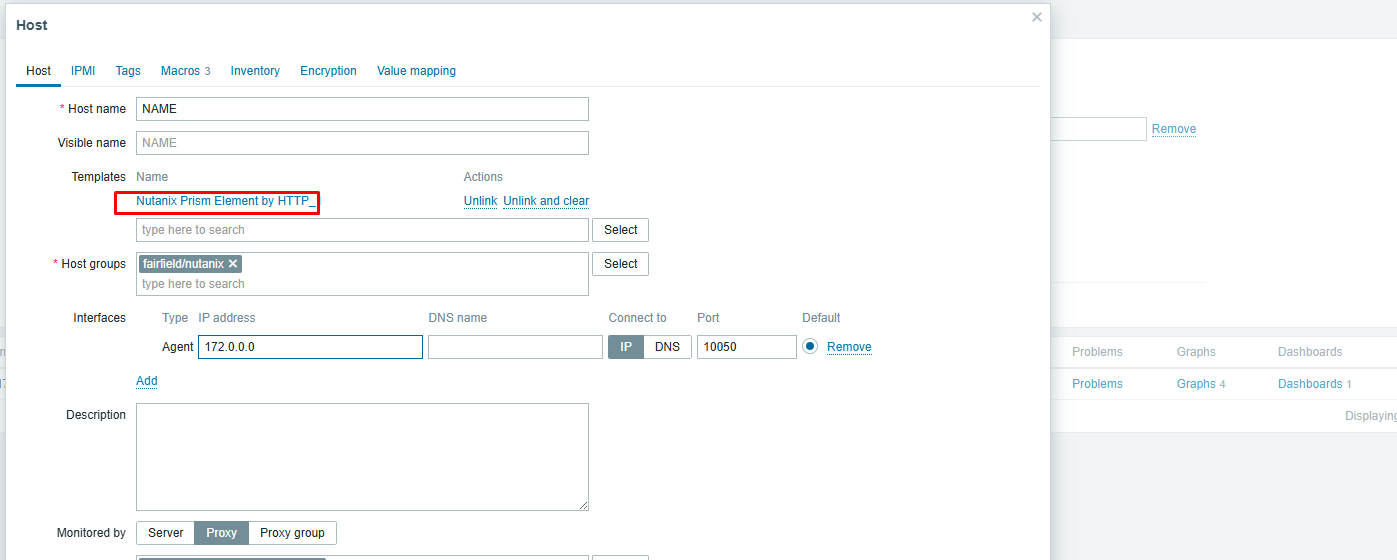
3. Link Nutanix Template
- While still on the host configuration page, navigate to the Templates tab.
- Click Select and search for the Nutanix monitoring template (e.g., Nutanix Prism Element by HTTP_1).
- Link the template to the host.
- Click Update to apply the changes.
4. Configure Discovery Rules (Optional)
The Nutanix template includes built-in discovery rules to automatically detect infrastructure components, including:
- Nutanix Clusters
- Filtered using
{$NUTANIX.CLUSTER.DISCOVERY.NAME.MATCHES} - Excluded using
{$NUTANIX.CLUSTER.DISCOVERY.NAME.NOT_MATCHES} - Nutanix Hosts
- Host discovery based on configurable name filters
- Storage Containers
- Automatic discovery of all available storage containers
These filters can be customized within the template macros to include or exclude specific clusters, hosts, or containers as required.
5. Verify Data Collection
After completing the configuration, Netwatch will begin collecting Nutanix metrics within a few minutes.
- Navigate to Monitoring → Latest Data.
- Select the Nutanix host.
- Confirm that the following metrics are populating:
- Storage capacity and utilization
- Cluster IOPS and IO latency
- Host CPU and memory usage
- Storage container capacity and usage
6. View Nutanix Dashboards
Netwatch provides pre-built dashboards for Nutanix environments to visualize infrastructure health and performance.
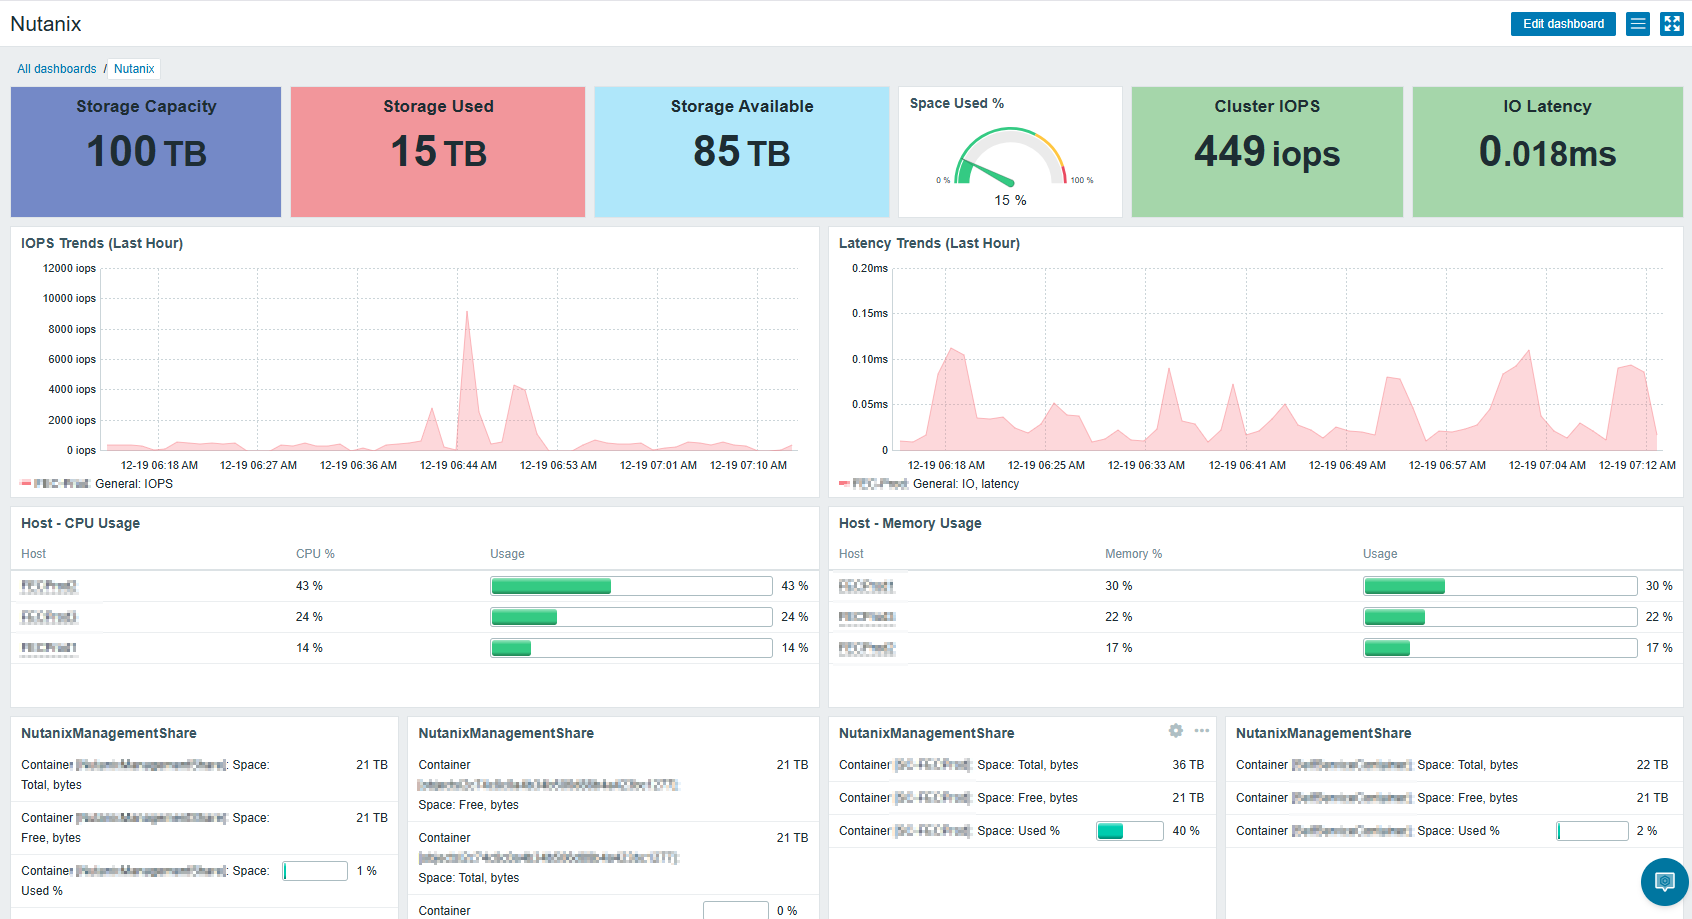
The dashboard includes:
- Storage Overview: Total, used, and available capacity
- Performance Metrics: Cluster IOPS and IO latency trends
- Host Resources: CPU and memory utilization across hypervisor hosts
- Container Details: Storage container usage and allocation
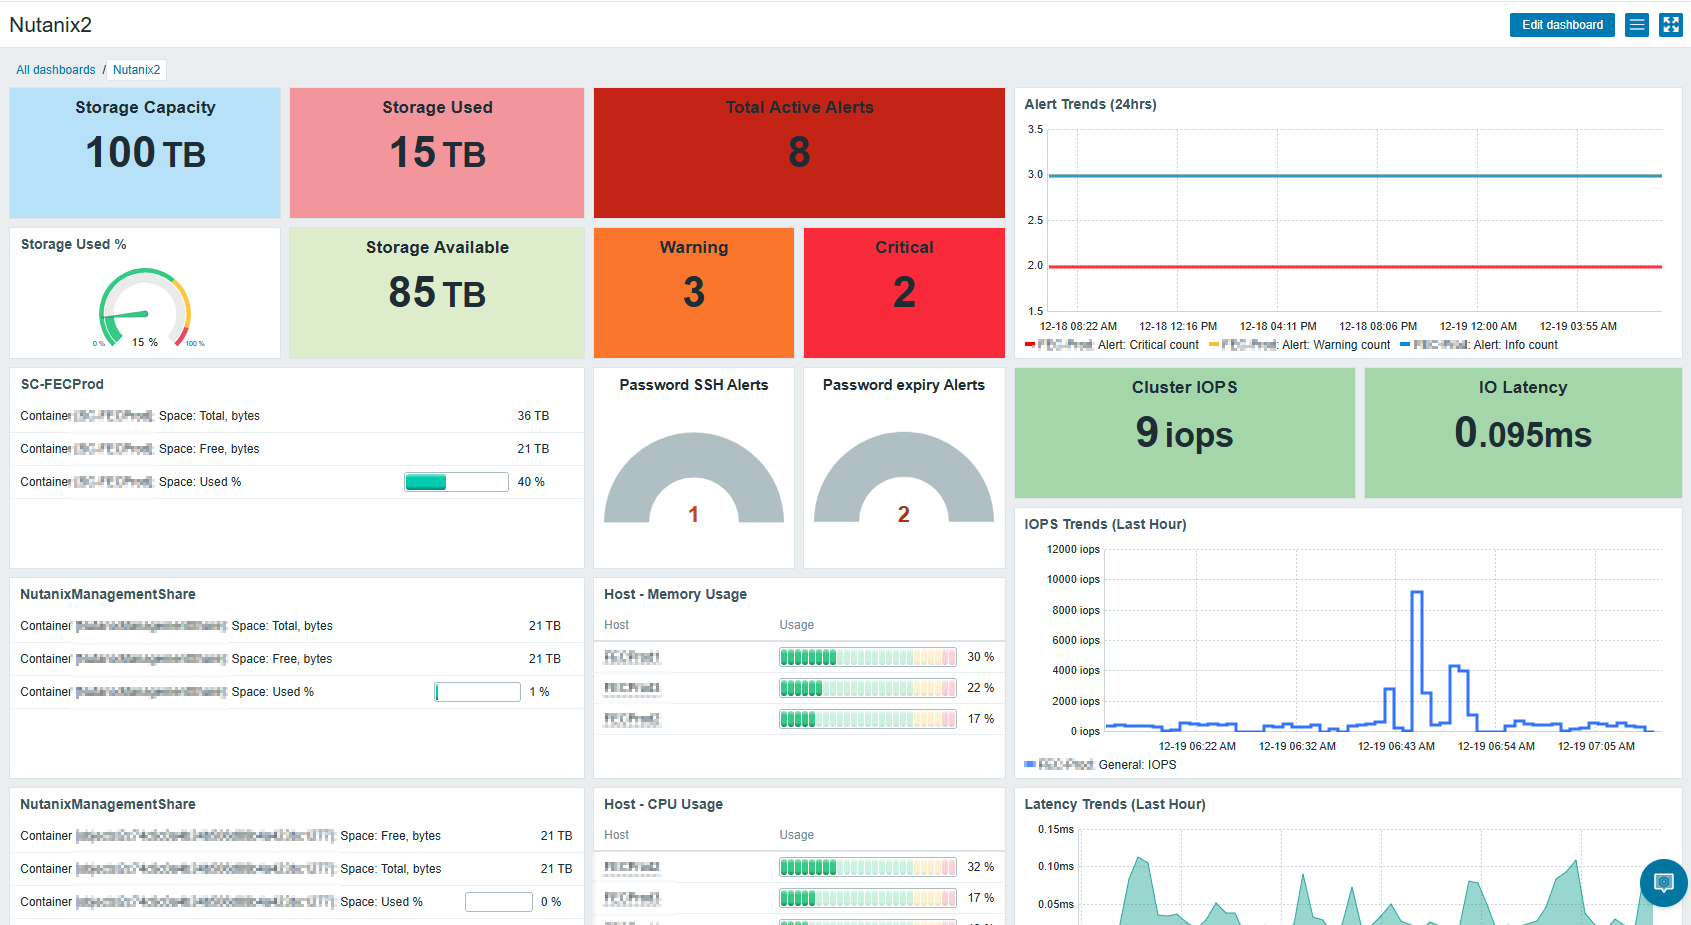
Additional dashboard features:
- Active Alerts: Real-time view of critical, warning, and informational alerts
- Alert Trends: Historical alert patterns over the last 24 hours
- Security Monitoring: SSH access and password expiry alerts