Configuring Apache CloudStack Monitoring in Netwatch
Overview
Netwatch supports monitoring of Apache CloudStack by combining CloudStack API authentication with a Prometheus exporter. This approach allows Netwatch to securely collect infrastructure, capacity, and performance metrics exposed by CloudStack while leveraging API credentials for authenticated access and validation.
Unlike simple HTTP checks, CloudStack monitoring requires:
- Enabling Prometheus metrics from the CloudStack UI
- Generating and configuring API Key and Secret Key
- Pointing Netwatch to the CloudStack Prometheus exporter endpoint
What Netwatch Monitors in CloudStack
Using the CloudStack Prometheus exporter, Netwatch can monitor:
- Infrastructure Metrics
- Zones, pods, clusters, and hosts
- Management server availability
- Compute Metrics
- Host CPU and memory utilization
- Virtual machine counts and states
- Storage Metrics
- Primary and secondary storage usage
- Capacity and allocation trends
- Networking Metrics
- Network usage statistics
- Public and private IP consumption
- Service Health
- CloudStack component availability
- API and exporter responsiveness
Prerequisites
Before configuring CloudStack monitoring in Netwatch, ensure:
- Apache CloudStack is deployed and operational
- Administrative access to the CloudStack UI
- Prometheus metrics support is available in your CloudStack version
- A Prometheus exporter endpoint is reachable from the Netwatch server
- A CloudStack API Key and Secret Key have been generated
- Network connectivity from Netwatch to the exporter endpoint (TCP 9595 by default)
1. Enable Prometheus Metrics in CloudStack
Prometheus metrics must be explicitly enabled in CloudStack.
- Log in to the CloudStack UI.
- Navigate to Global Settings.
- Locate and enable the Prometheus-related settings, for example:
prometheus.enable = trueprometheus.exporter.enabled = true
- Save the changes.
- Restart CloudStack management services if required.
Once enabled, verify access to the exporter:
2. Generate CloudStack API Key and Secret
- In the CloudStack UI, go to Accounts.
- Select the appropriate account or user.
- Generate or retrieve the API Key and Secret Key.
- Store both securely; they will be required by Netwatch.
3. Add CloudStack Host in Netwatch
- Navigate to Configuration → Hosts.
- Click Create Host.
- Enter the following details:
- Host name: A descriptive name (e.g., CloudStack-Production)
- Host group: Cloud / Virtualization
- Agent interface: CloudStack management IP or hostname
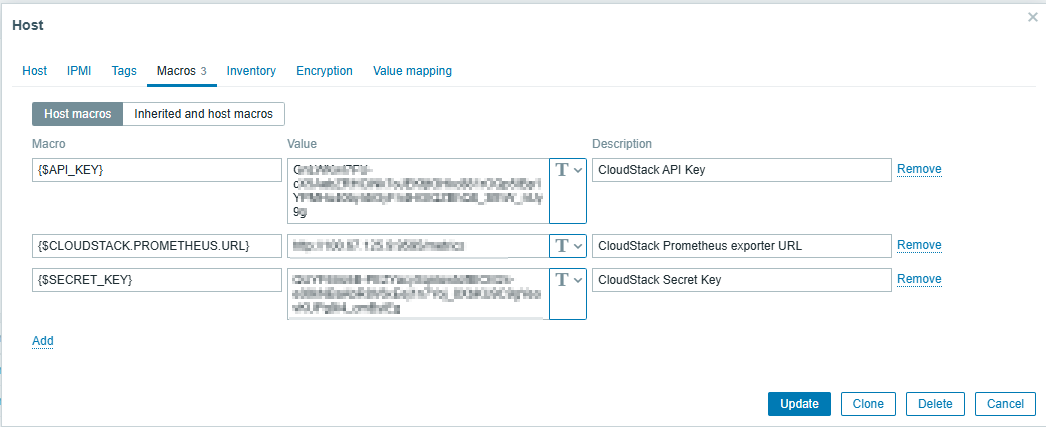
4. Configure Host Macros
CloudStack authentication and metric collection are driven by host macros.
Go to the Macros tab and add the following:
| Macro | Value | Description |
|---|---|---|
{$API_KEY} | <cloudstack-api-key> | CloudStack API Key |
{$SECRET_KEY} | <cloudstack-secret-key> | CloudStack Secret Key (Secret Text) |
{$CLOUDSTACK.PROMETHEUS.URL} | http://<cloudstack-ip>:9595/metrics | CloudStack Prometheus exporter URL |
Important notes:
- Store the Secret Key as a Secret Text macro
- Ensure the Prometheus URL is reachable from the Netwatch server
- The exporter must be enabled in the CloudStack UI
Example:
{$API_KEY}→GnLWKwl7FU-...{$SECRET_KEY}→QUYF6Vo5B-...{$CLOUDSTACK.PROMETHEUS.URL}→http://XXX.XXX.XXX.XXX:9595/metrics
5. Verify Data Collection
After configuration, Netwatch will begin collecting metrics within a few minutes.
- Navigate to Monitoring → Latest Data
- Select the CloudStack host
- Verify that metrics are populating, including:
- Host and cluster capacity
- CPU and memory utilization
- Storage usage
- API and exporter availability
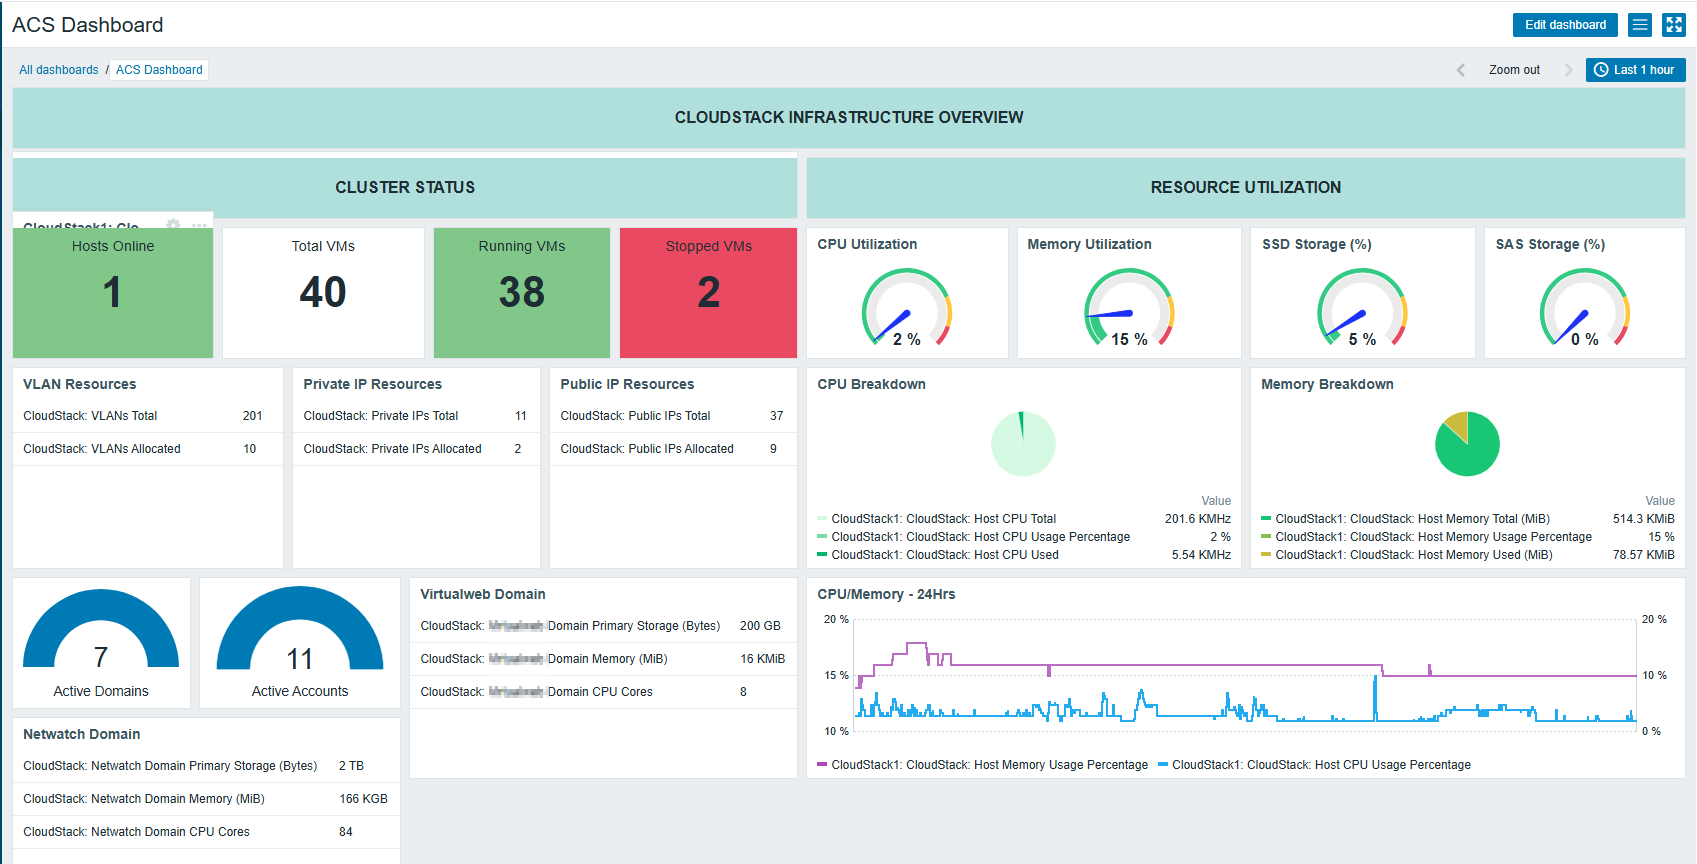
7. CloudStack Dashboards
Netwatch dashboards provide centralized visibility into CloudStack health and performance.
Typical dashboard sections include:
- Infrastructure overview (zones, clusters, hosts)
- Compute and storage utilization
- Capacity trends
- Service availability indicators
Key Considerations
- Prometheus metrics must be enabled in the CloudStack UI
- API Key and Secret Key are required for authenticated access
- The Prometheus exporter endpoint must be reachable by Netwatch
- Secure sensitive values using Secret Text macros
- Firewall rules must allow access to TCP port 9595