Netwatch Configurations
Creating Widgets in Netwatch
A guide on how to create and configure widgets in Netwatch dashboards.
Overview
Widgets in Netwatch allow users to visualize monitoring data effectively within dashboards. Different types of widgets can be used for various metrics.
Steps to Create a Widget
1. Access an Existing Dashboard
- Navigate to Monitoring > Dashboards.
- Select an existing dashboard or create a new one.

2. Add a New Widget
- Click on Add Widget.
- Choose the type of widget to add (e.g., Graph, Problems, Map, Clock).

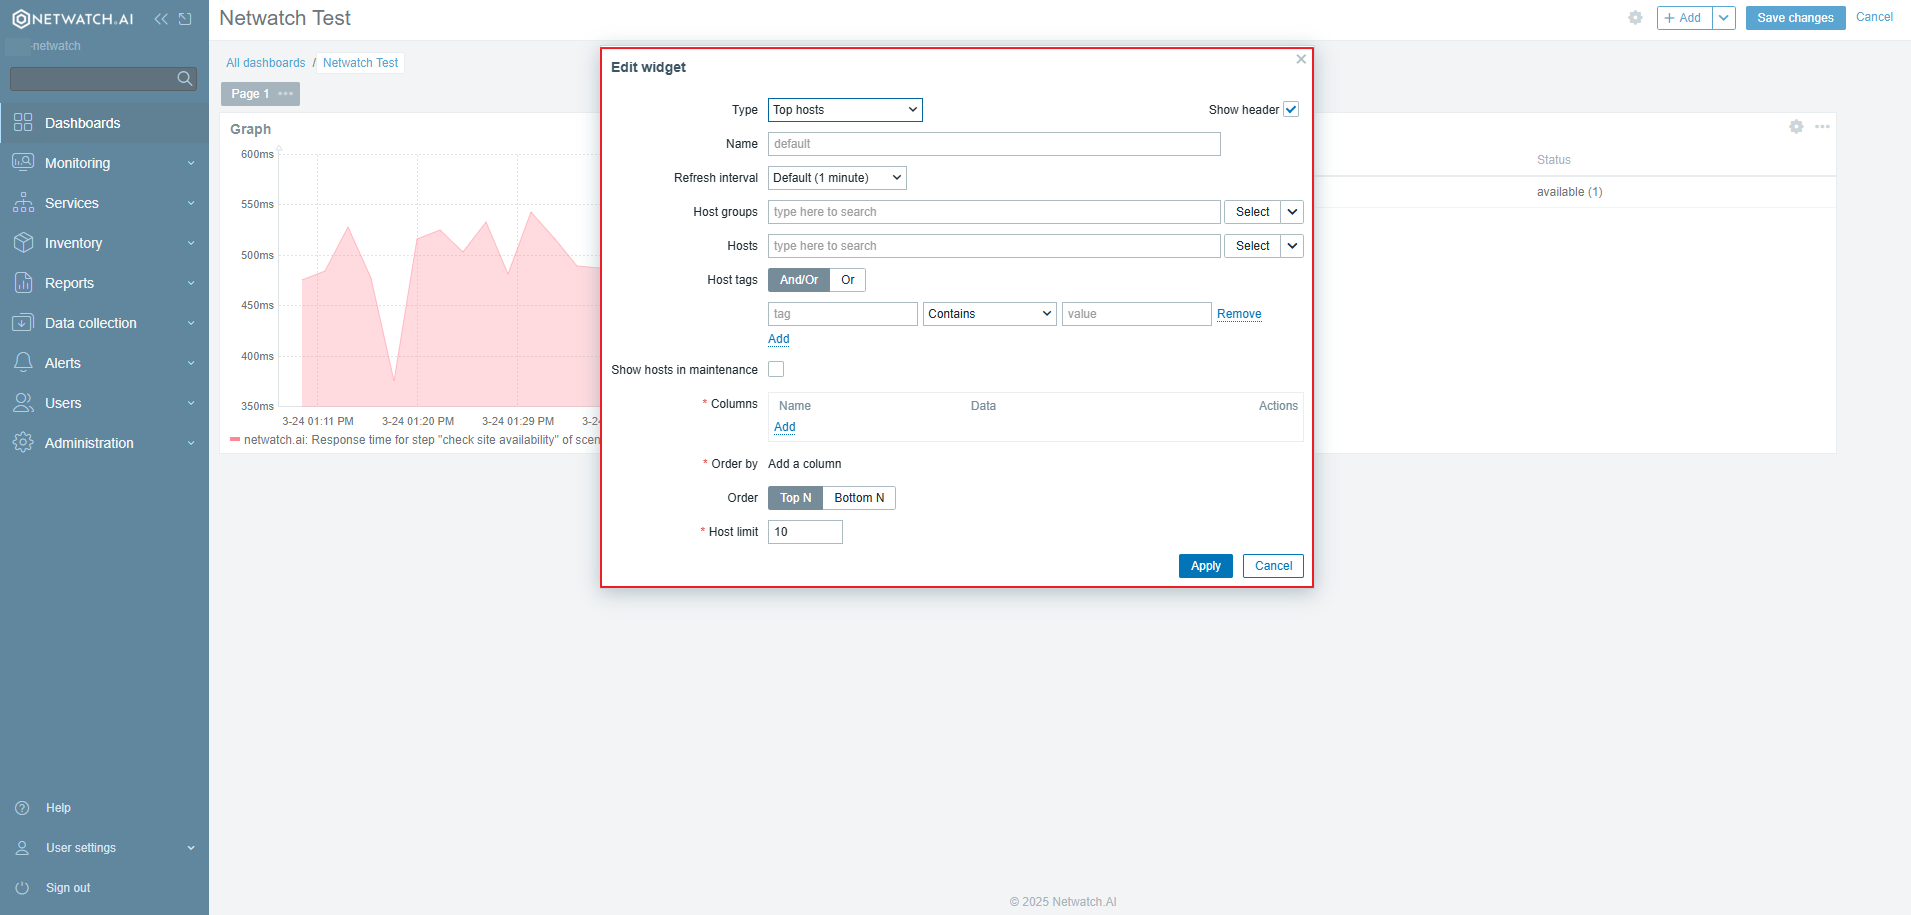
3. Configure Widget Settings
- Title: Provide a descriptive name for the widget.
- Data Source: Select the relevant data (e.g., a specific host or item).
- Visualization Options: Customize colors, thresholds, and display modes.
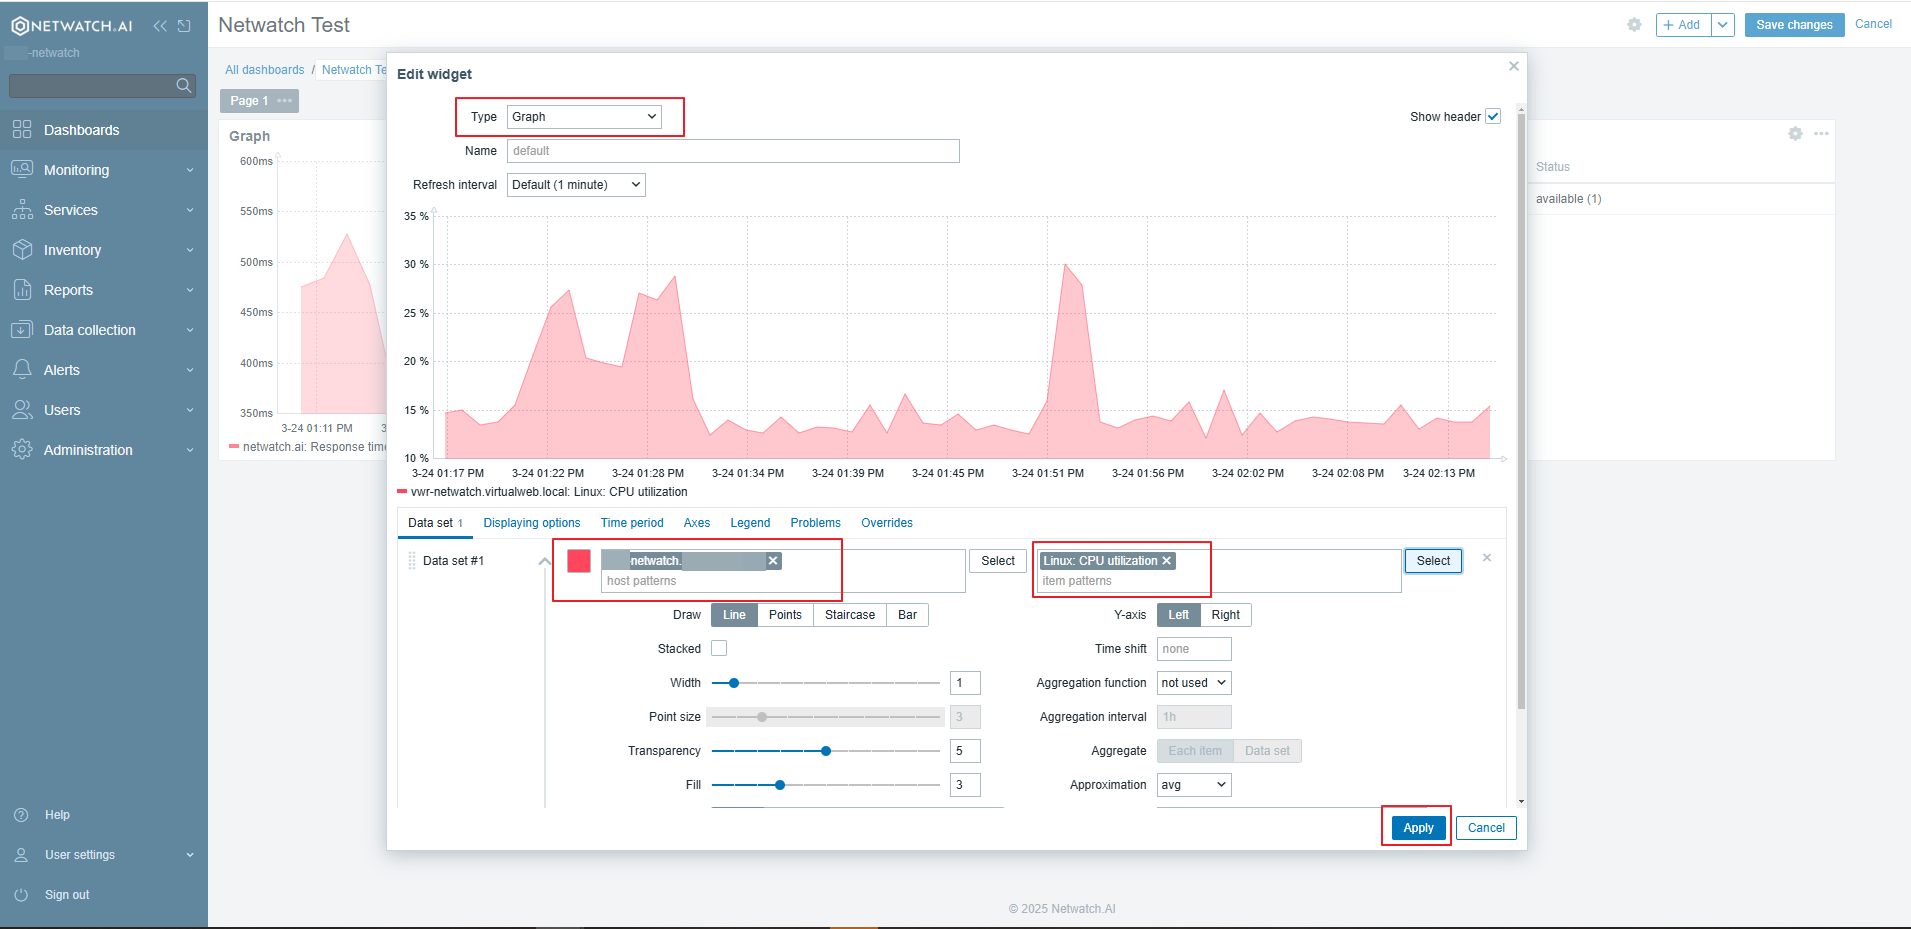
Example: Adding a CPU Usage Graph Widget
- Click on Add Widget.
- Select Graph from the widget list.
- Choose CPU Utilization as the metric.
- Adjust settings such as the refresh interval and display style.
- Click Apply to Apply the widget.
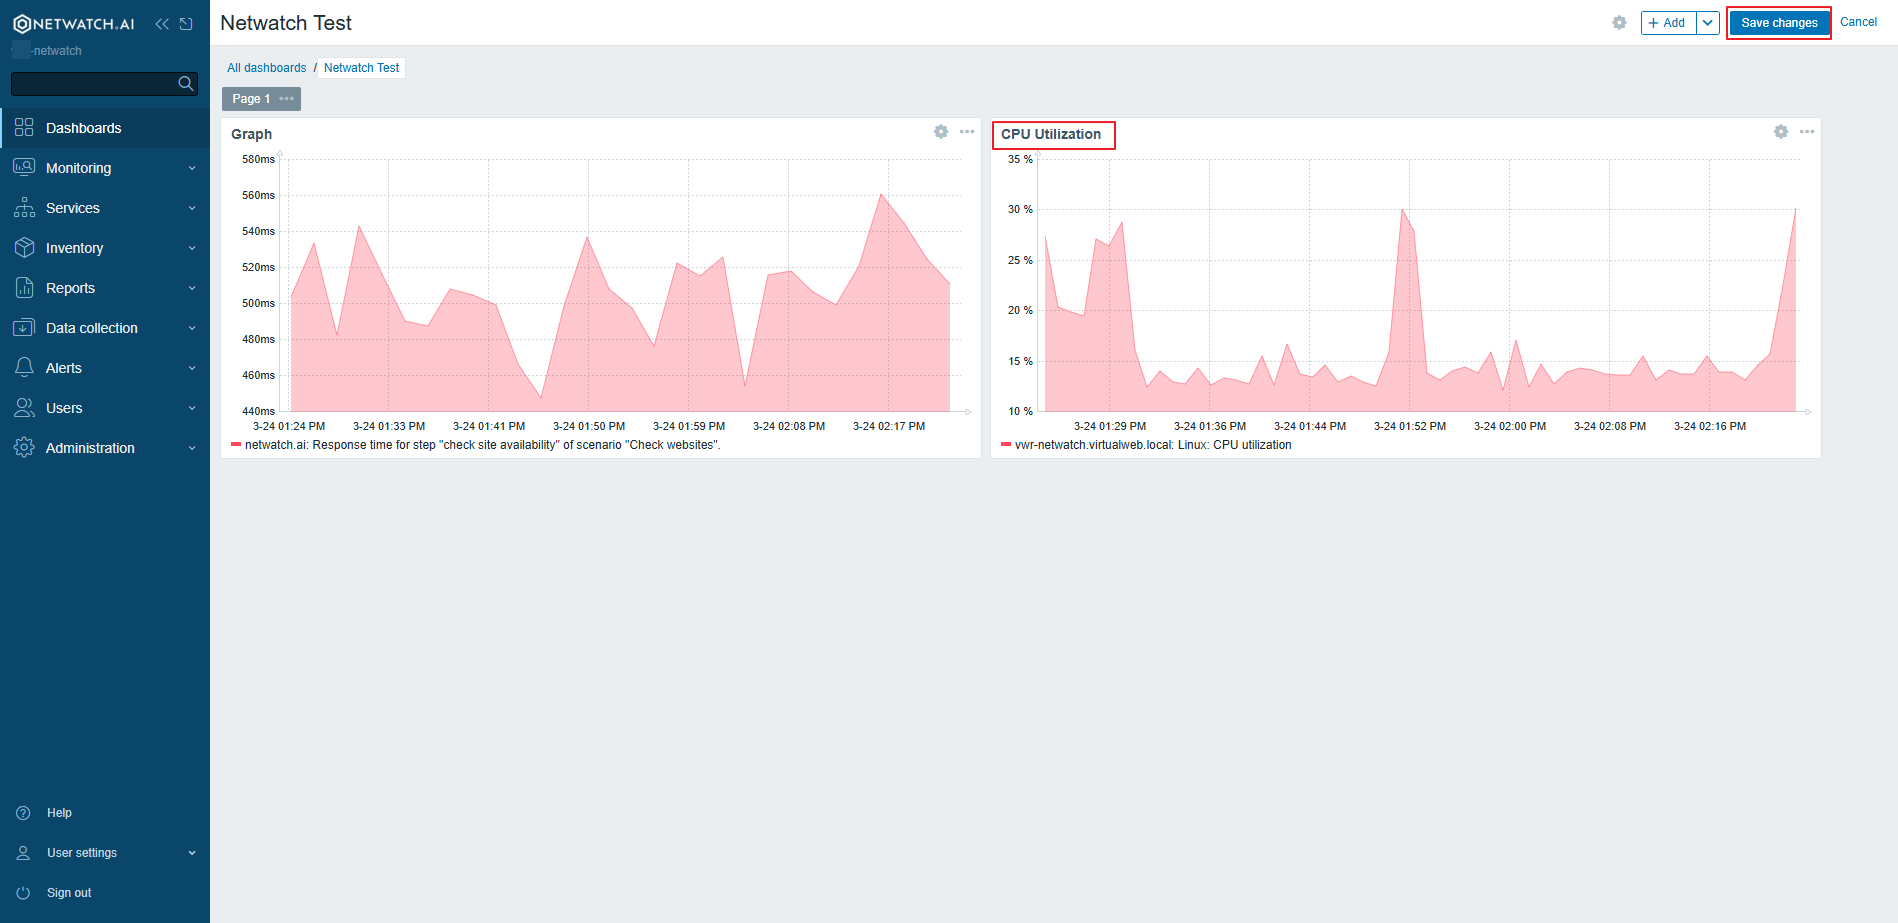
4. Save the Widget
- Click Apply to apply the changes.
Example Widgets
- Graph Widget: Displays time-series data for a selected metric.
- Problems Widget: Lists active issues detected in the monitoring system.
- Map Widget: Visualizes the network topology.
- Clock Widget: Shows the current time in different time zones.
Best Practices
- Use widgets that provide meaningful insights into system performance.
- Avoid cluttering dashboards with too many widgets.
Widgets enhance Netwatch dashboards by providing clear, interactive monitoring insights.