Netwatch Configurations
Creating Dashboards in Netwatch
Step-by-step guide on how to create and customize dashboards in Netwatch.
Overview
Dashboards in Netwatch provide a consolidated view of your monitoring data, allowing you to visualize and analyze information effectively.
Steps to Create a Dashboard
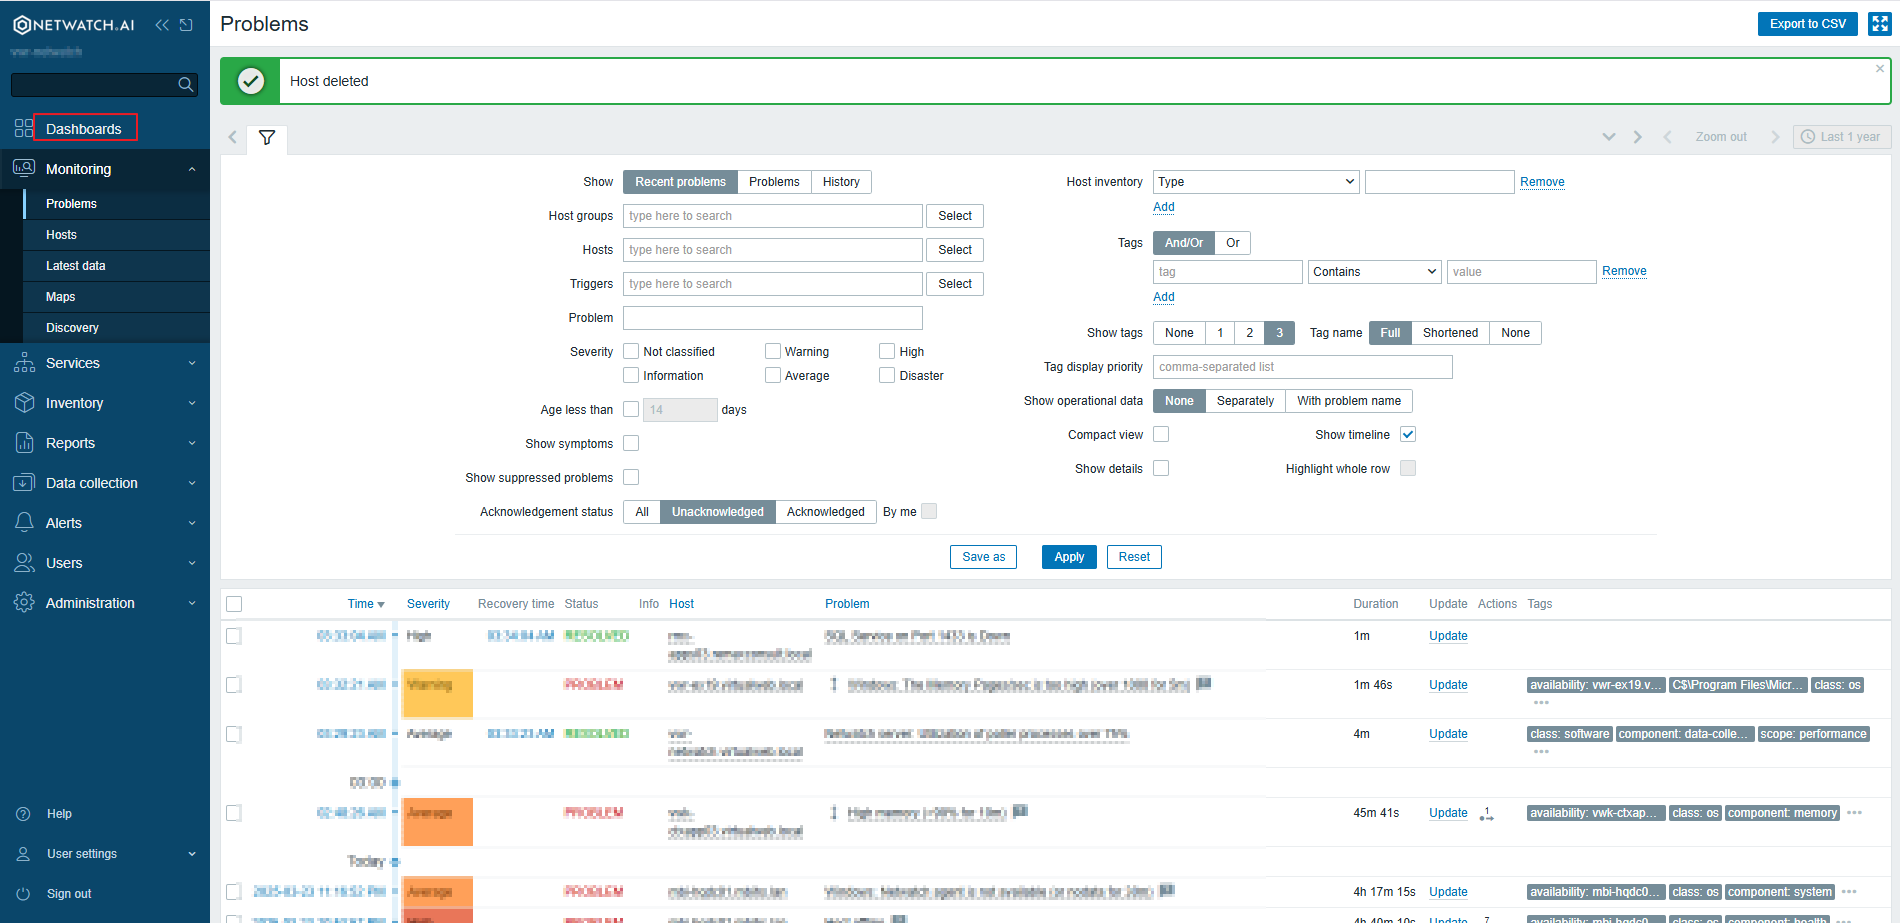
1. Access the Dashboard Section
- Navigate to the Navigation bar tab in the Netwatch interface.
- Select Dashboards from the menu.
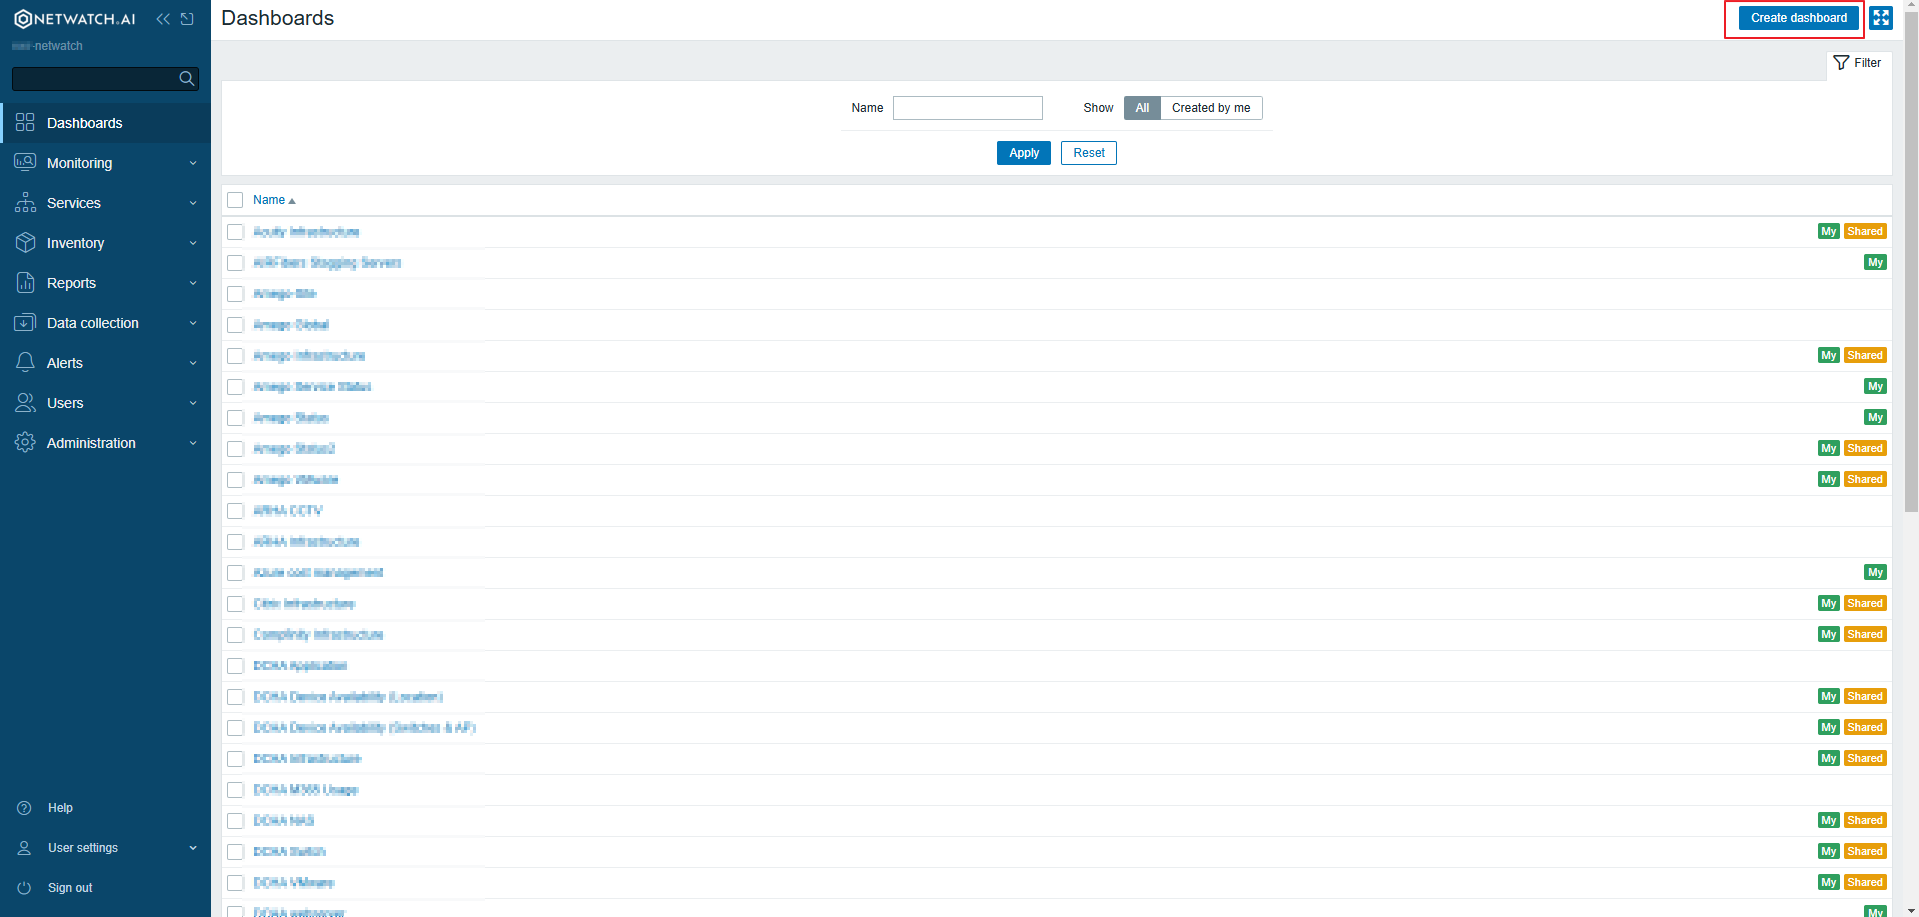
2. Create a New Dashboard
- Click on the Create Dashboard button.
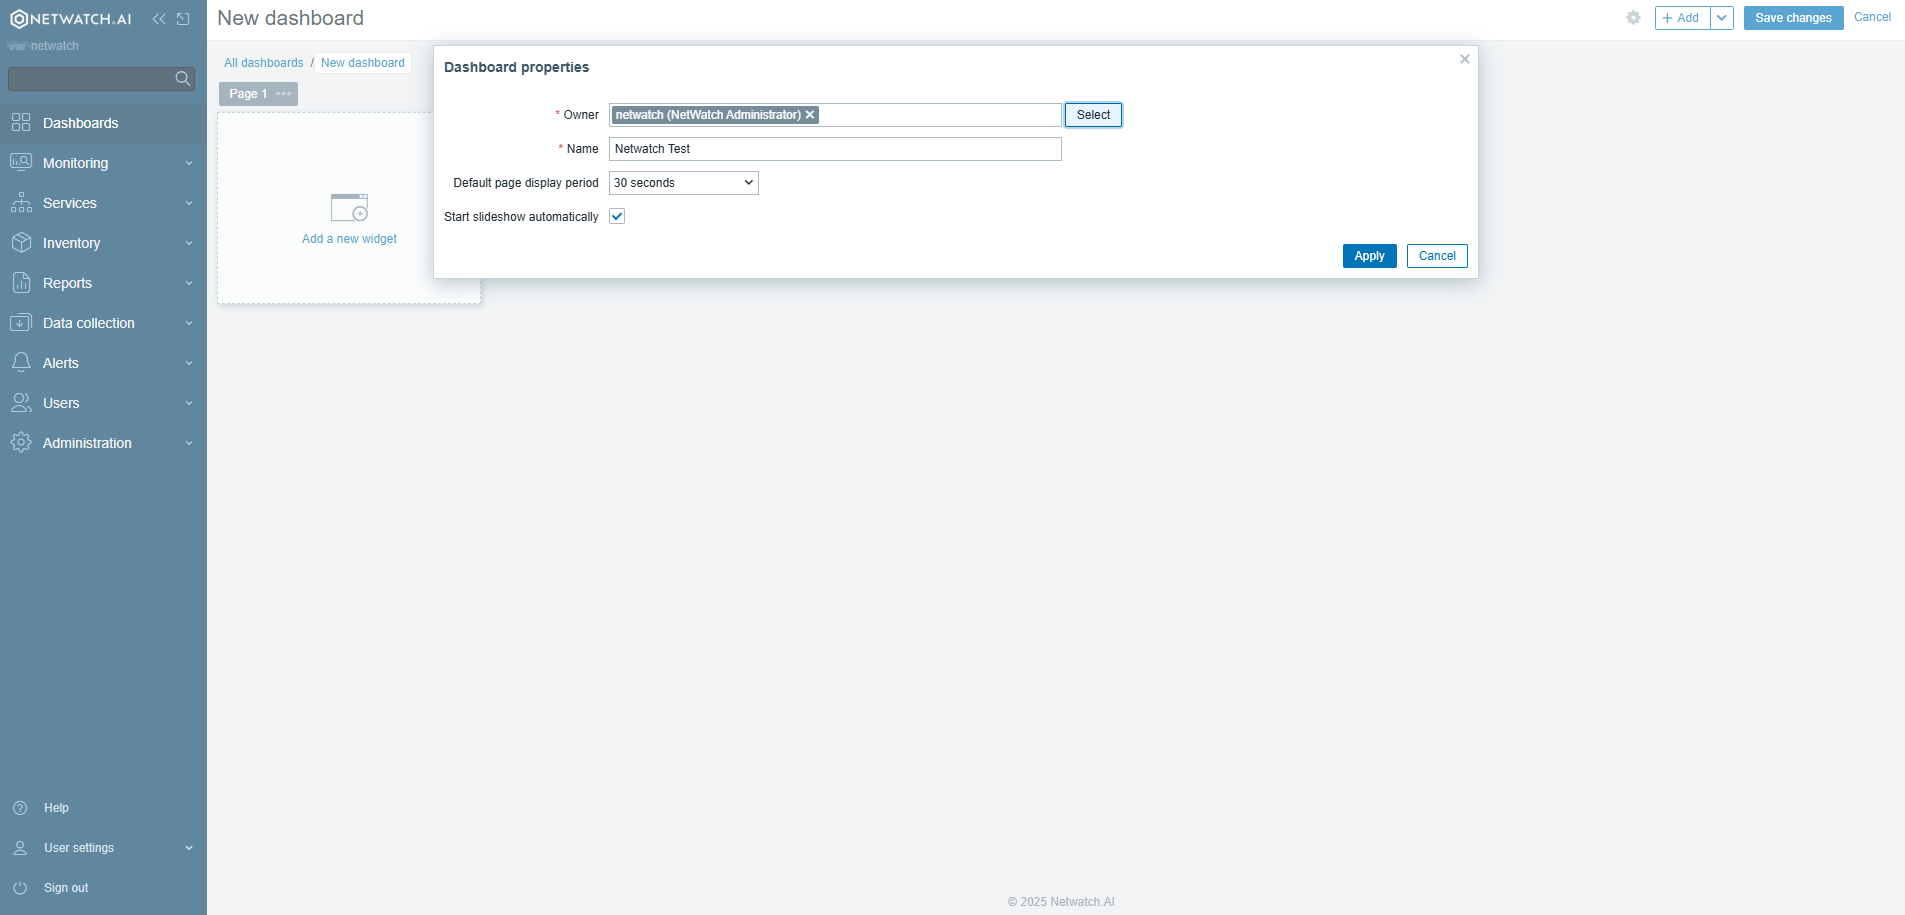
3. Configure Dashboard Settings
- Name: Enter a unique name for the dashboard.
- Widgets: Add widgets (e.g., graphs, problems, maps) to display monitoring data.
- Layout: Arrange widgets as desired to customize the dashboard layout.
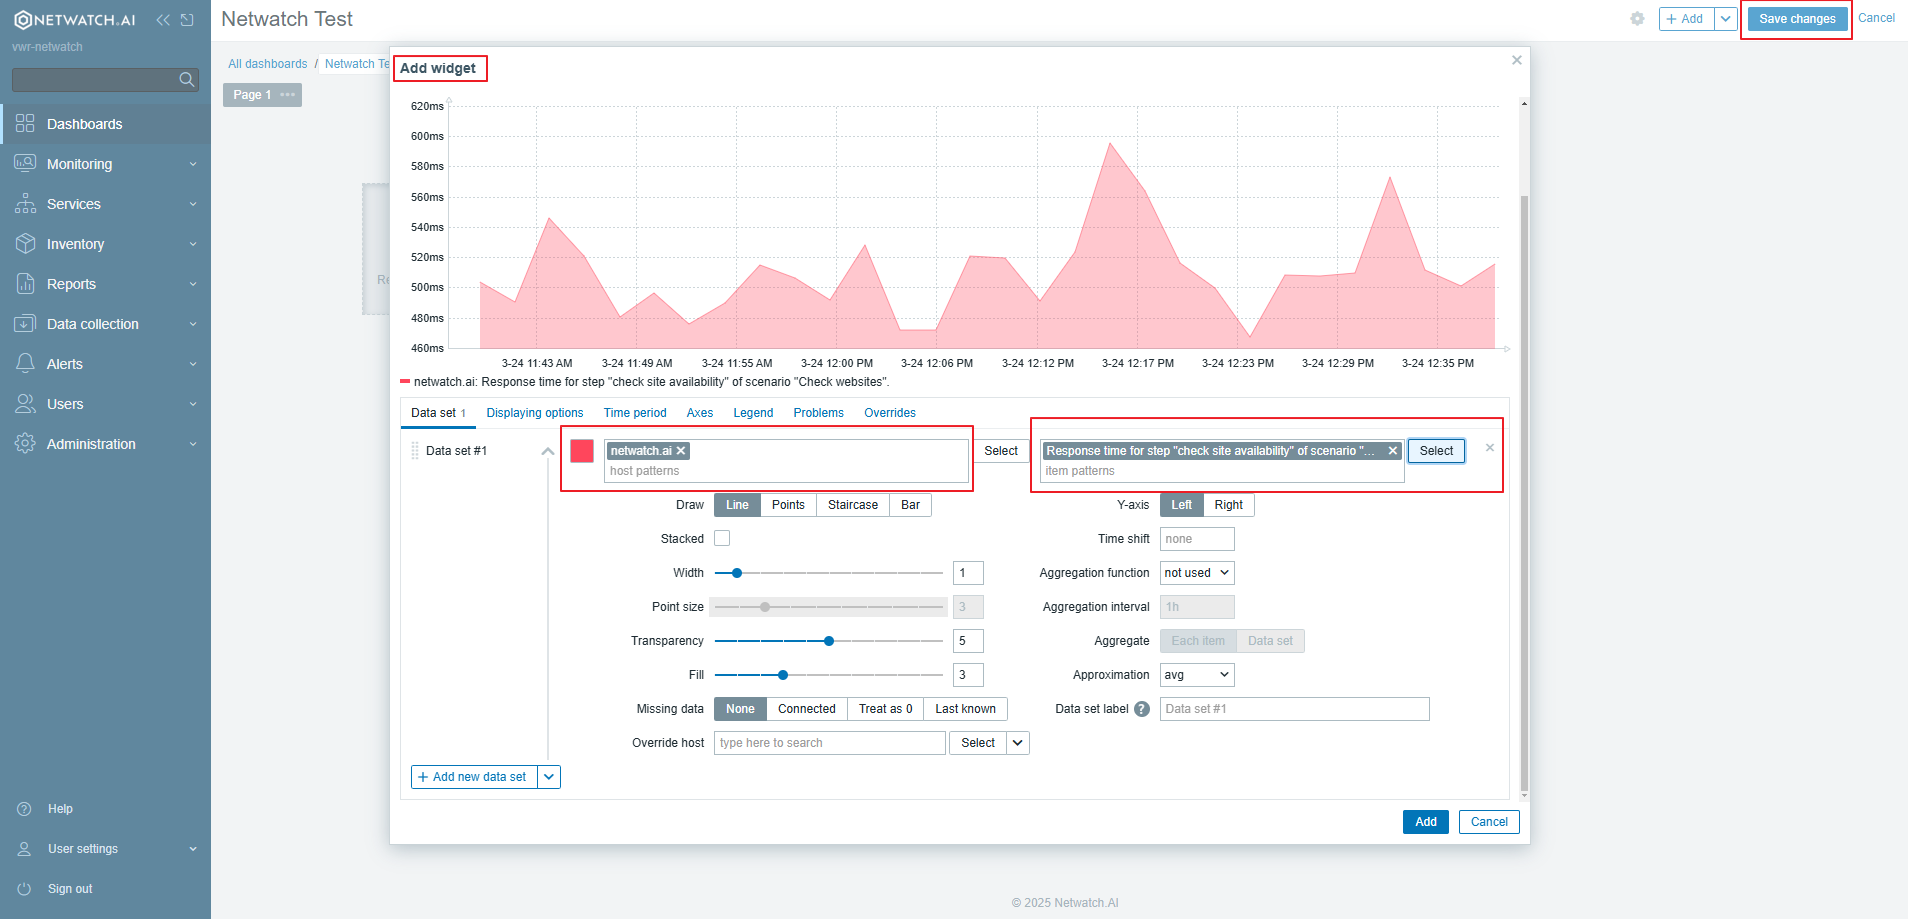
Example: Adding a Graph Widget
- Click on Add Widget.
- Select Graph from the widget list.
- Choose the metric you want to display (e.g., CPU usage, network traffic).
- Customize the graph settings (title, refresh interval, etc.).
- Click Apply to add the widget to your dashboard.
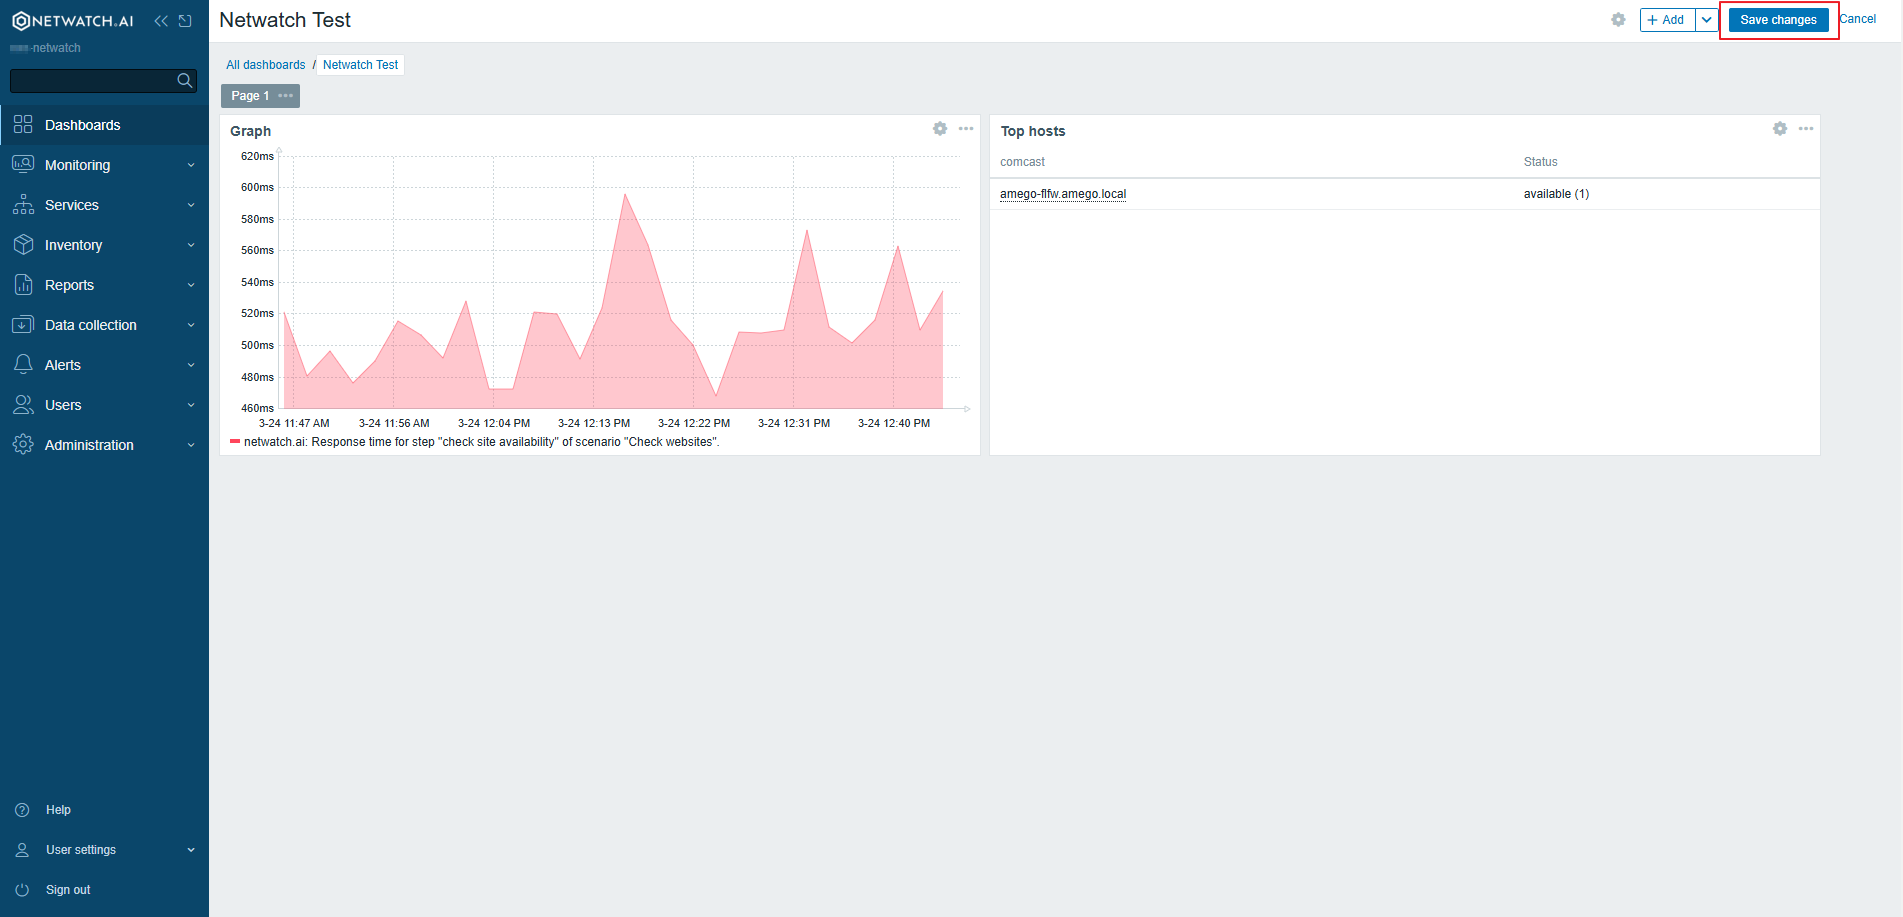
4. Save the Dashboard
- Click Save to create the dashboard.
Best Practices
- Keep dashboards simple and focused on key metrics.
- Use a mix of widgets for a balanced visual representation.
- Regularly update dashboards to reflect changing monitoring needs.
Dashboards enhance visibility and allow quick access to critical system performance data in Netwatch.